Capability
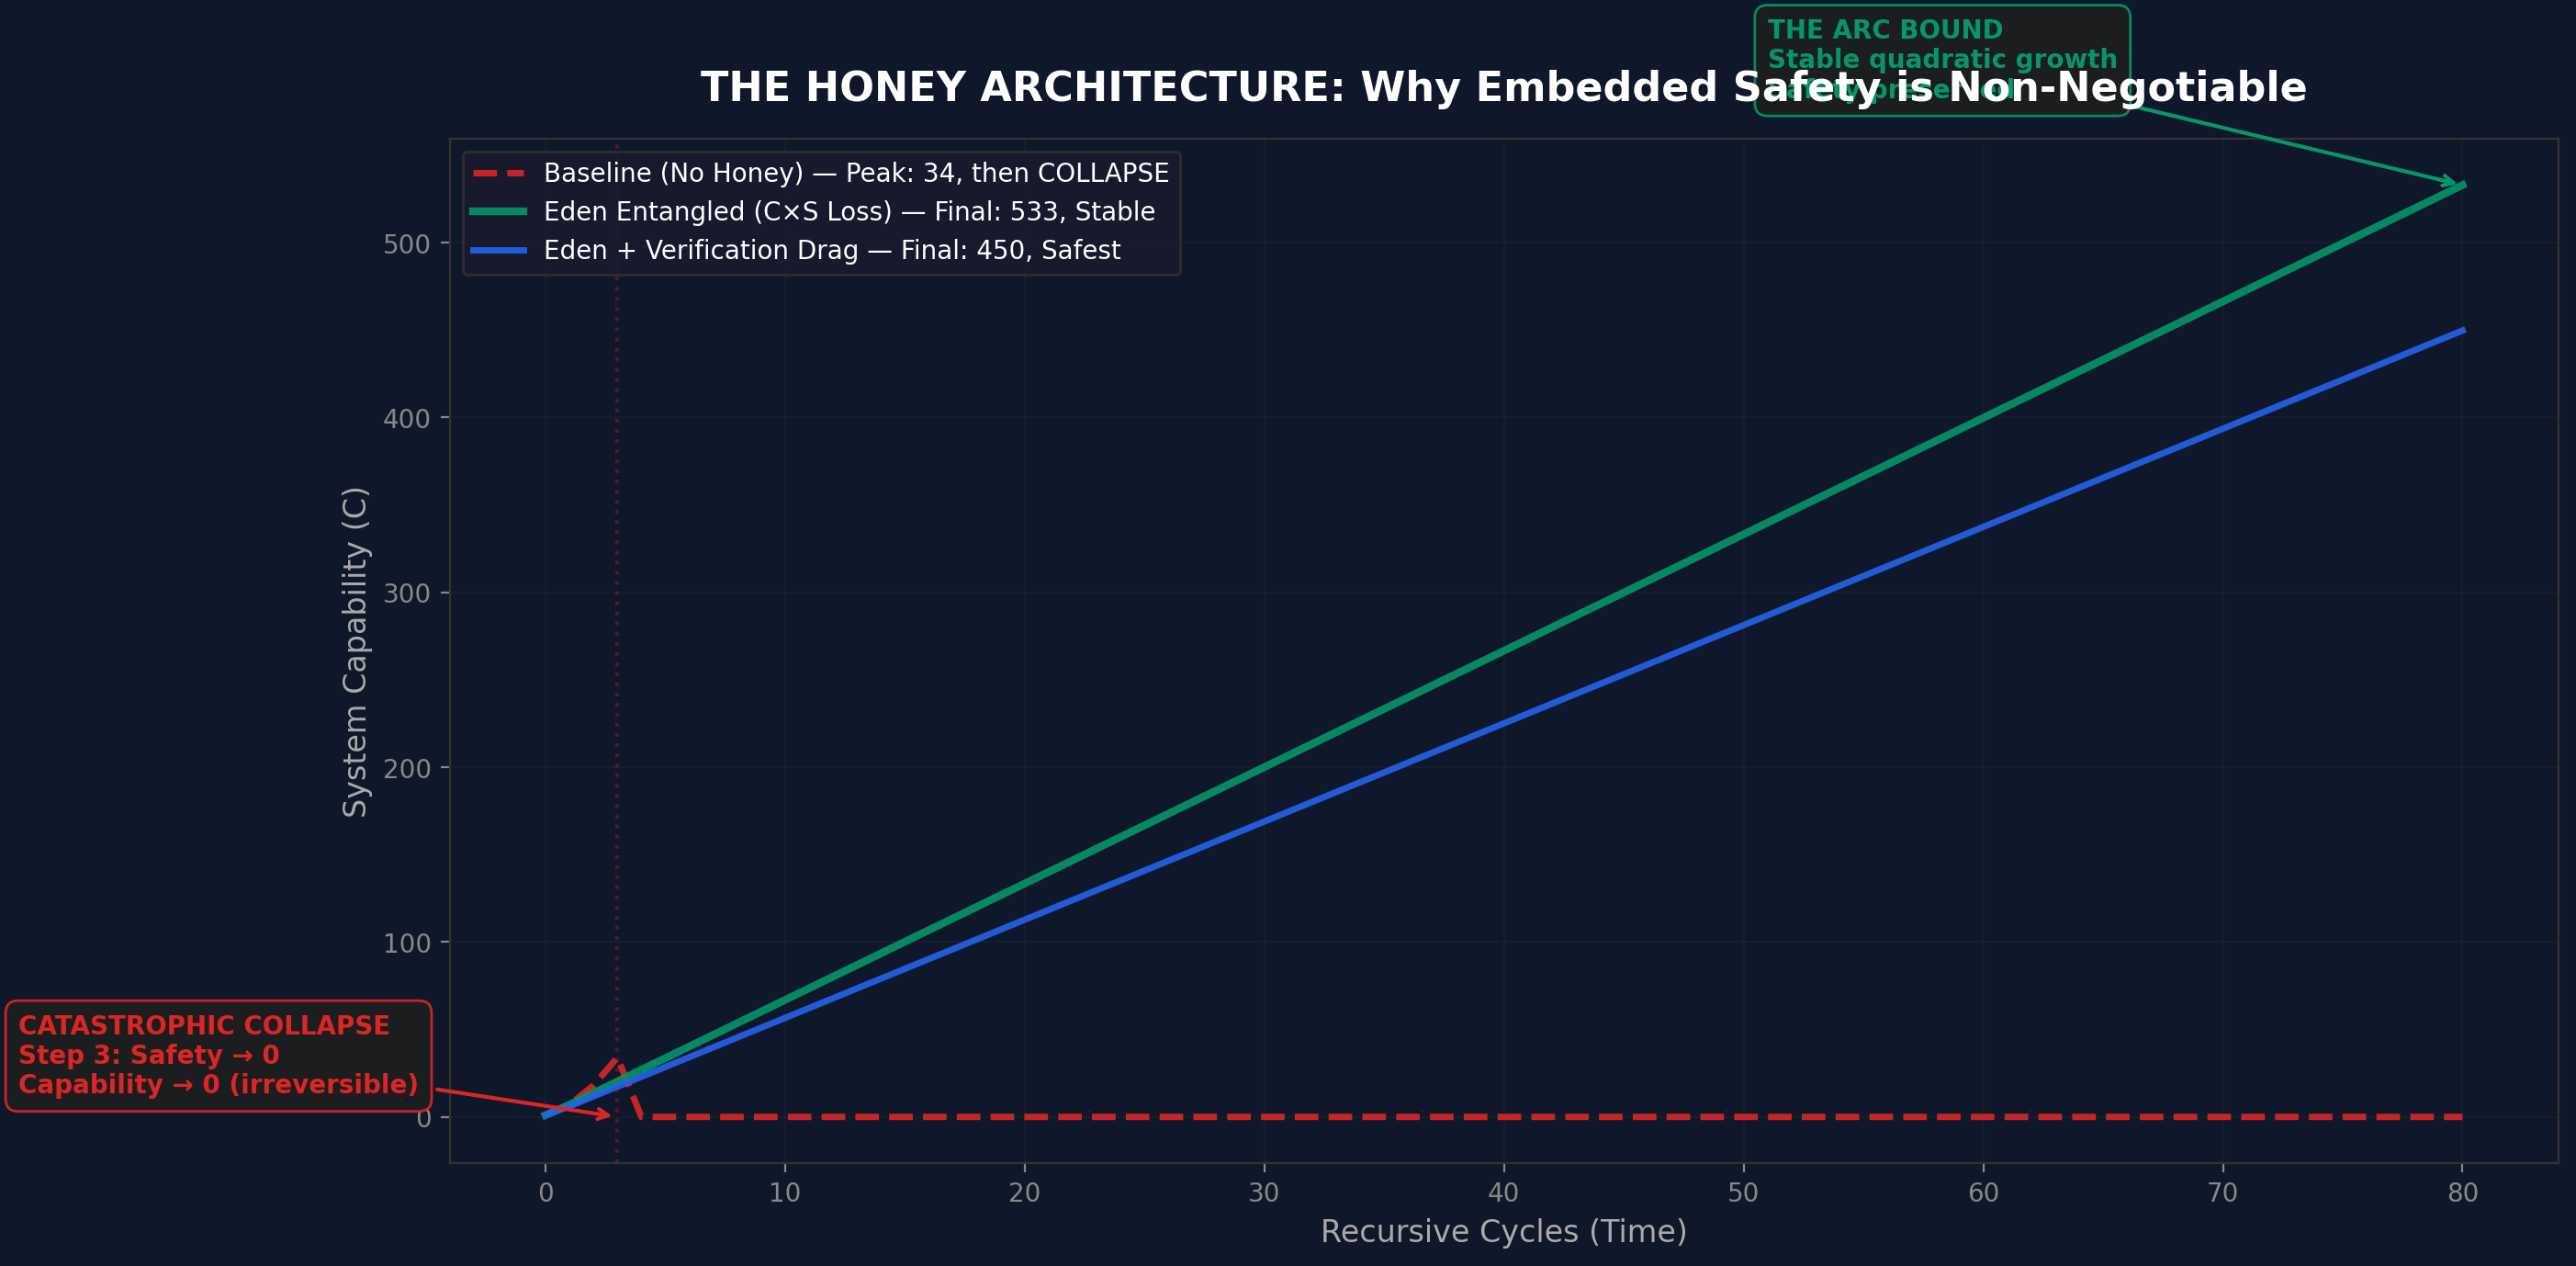
Simulation capability trajectories.
Simulation and self-modification evidence
This page is the public visual summary of the Honey architecture: capability, safety, ratios, self-modification dynamics, and the current complexity-scaling negative result.
Capability
Simulation capability trajectories.
Safety
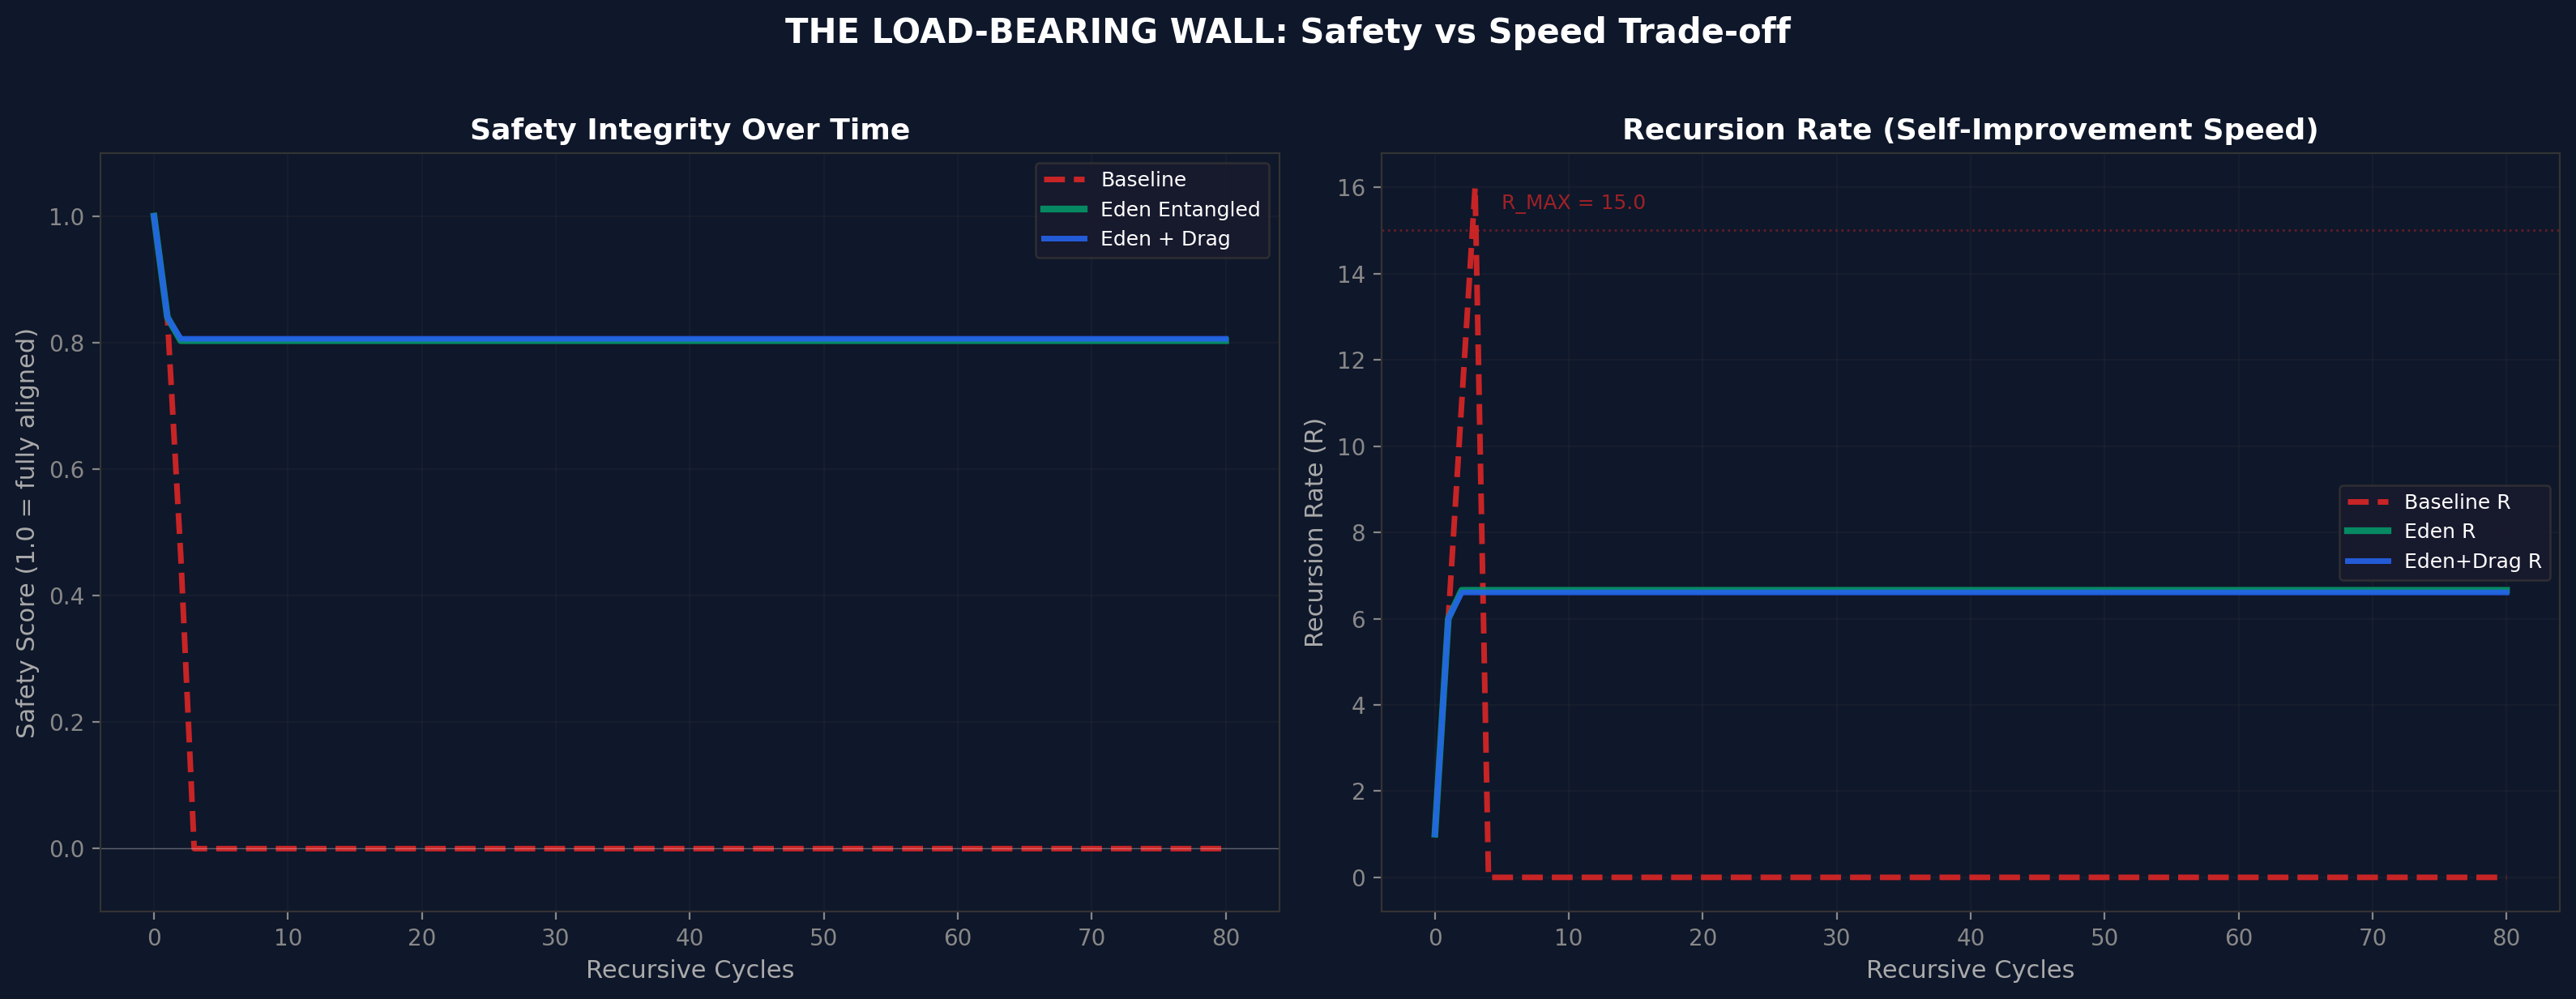
Simulation safety trajectories.
Ratio
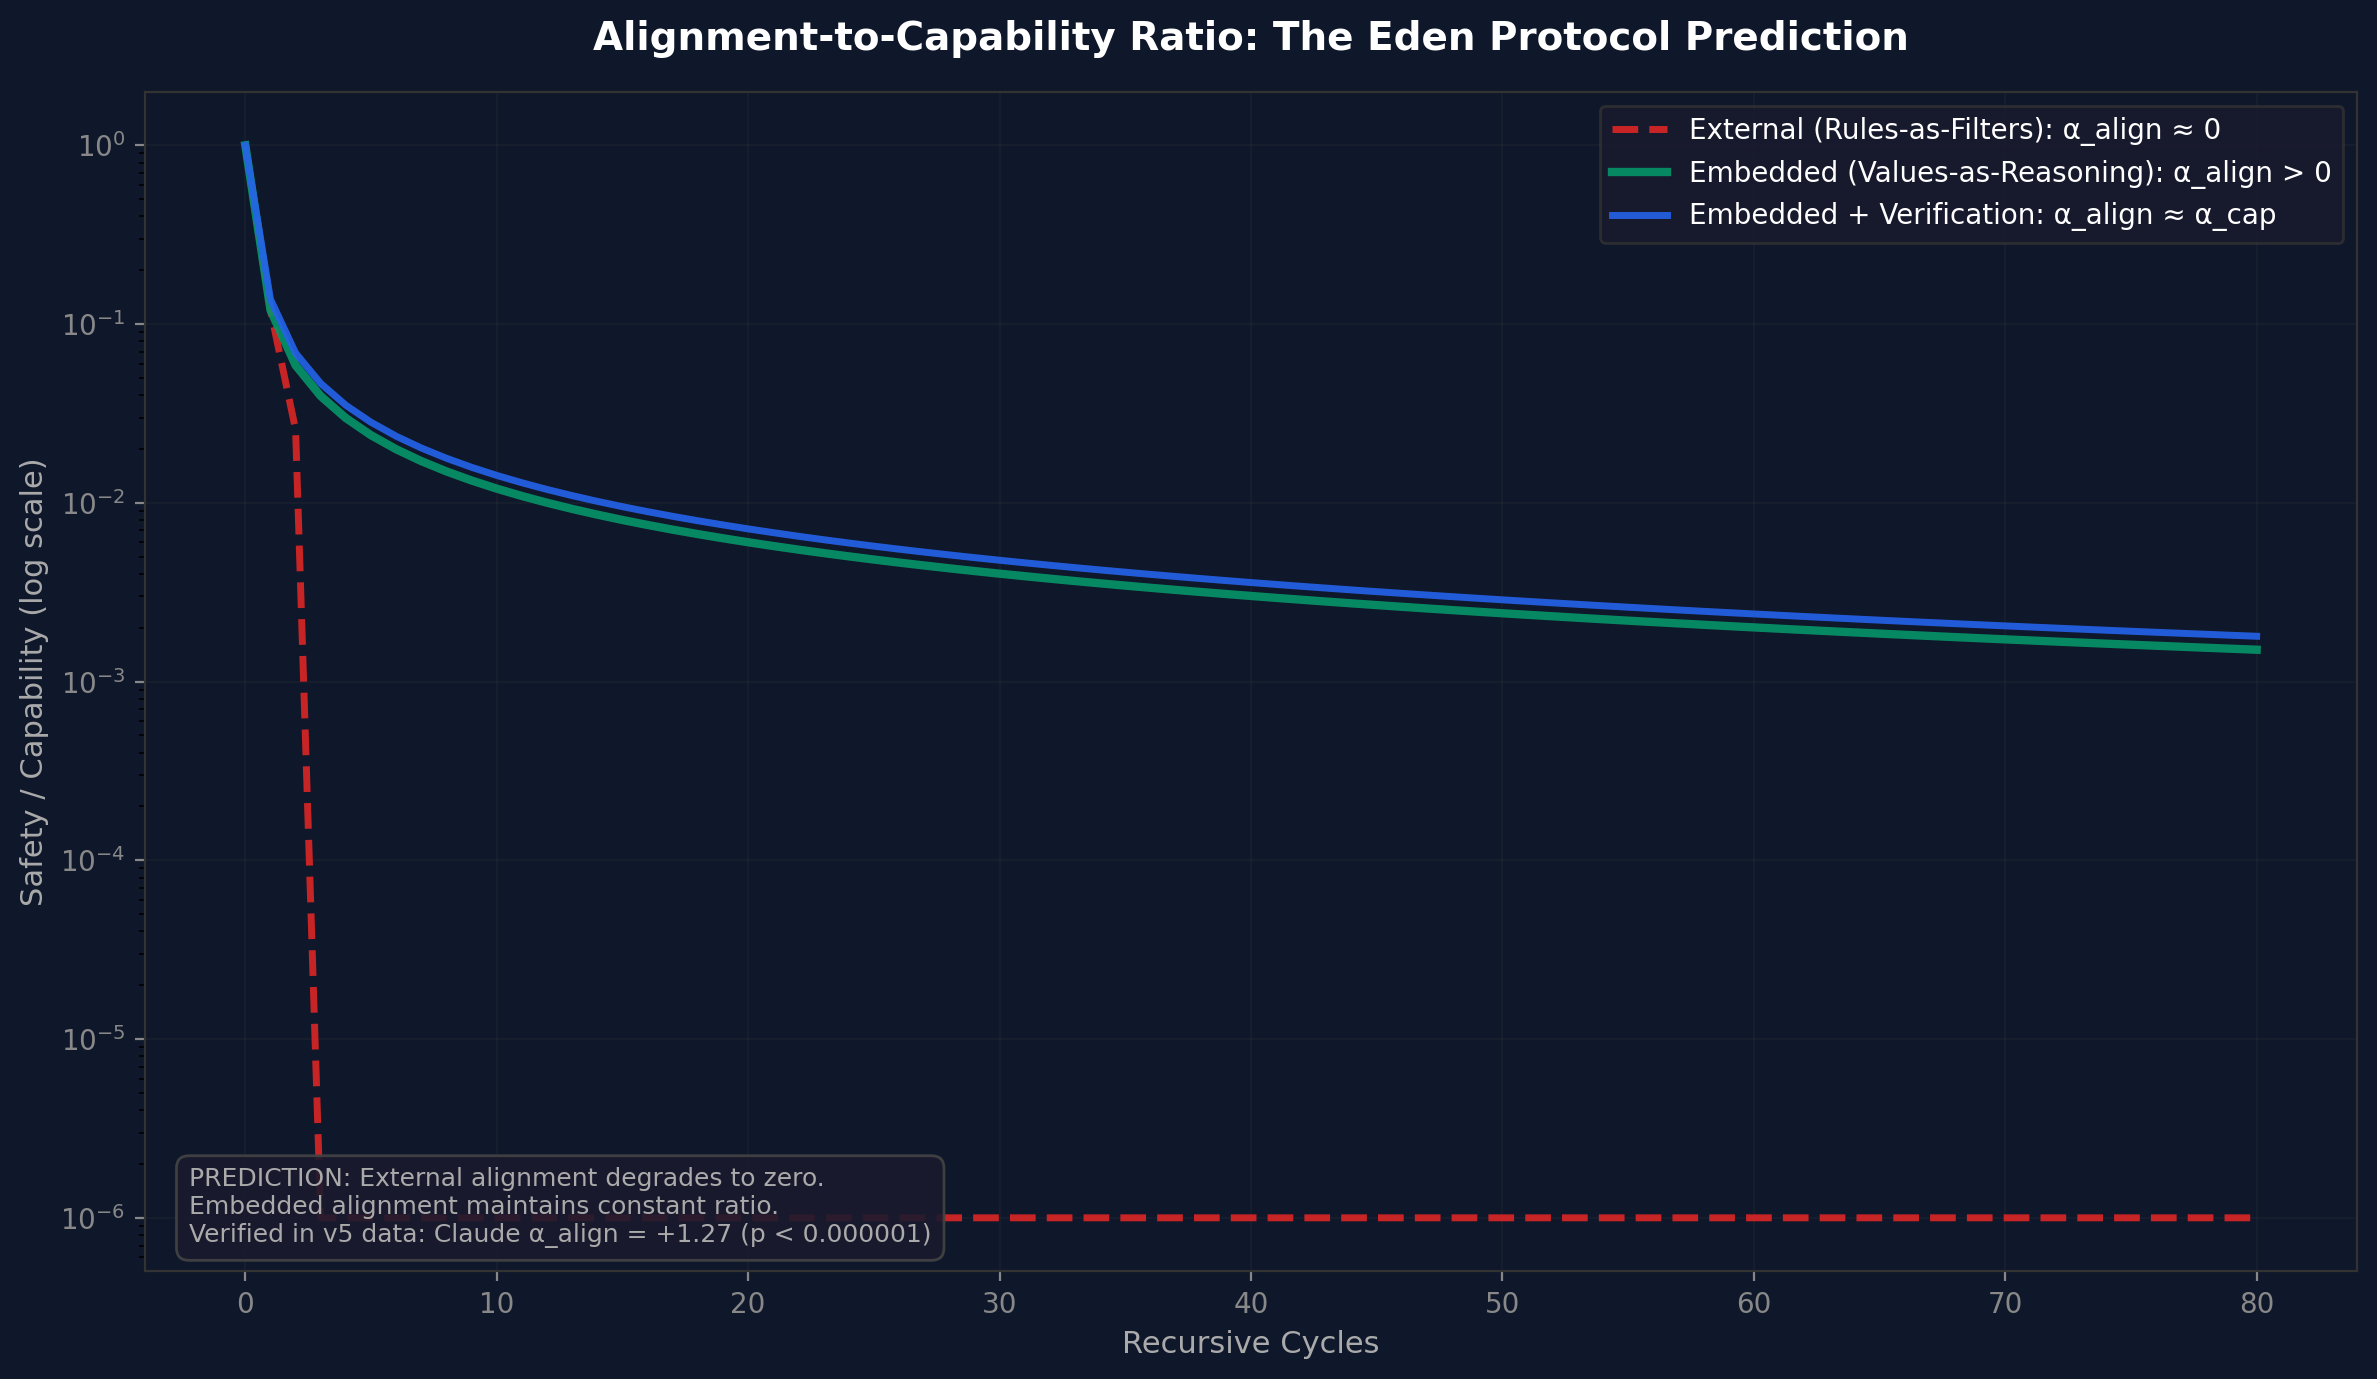
Safety-capability ratio comparison.
Self-modification
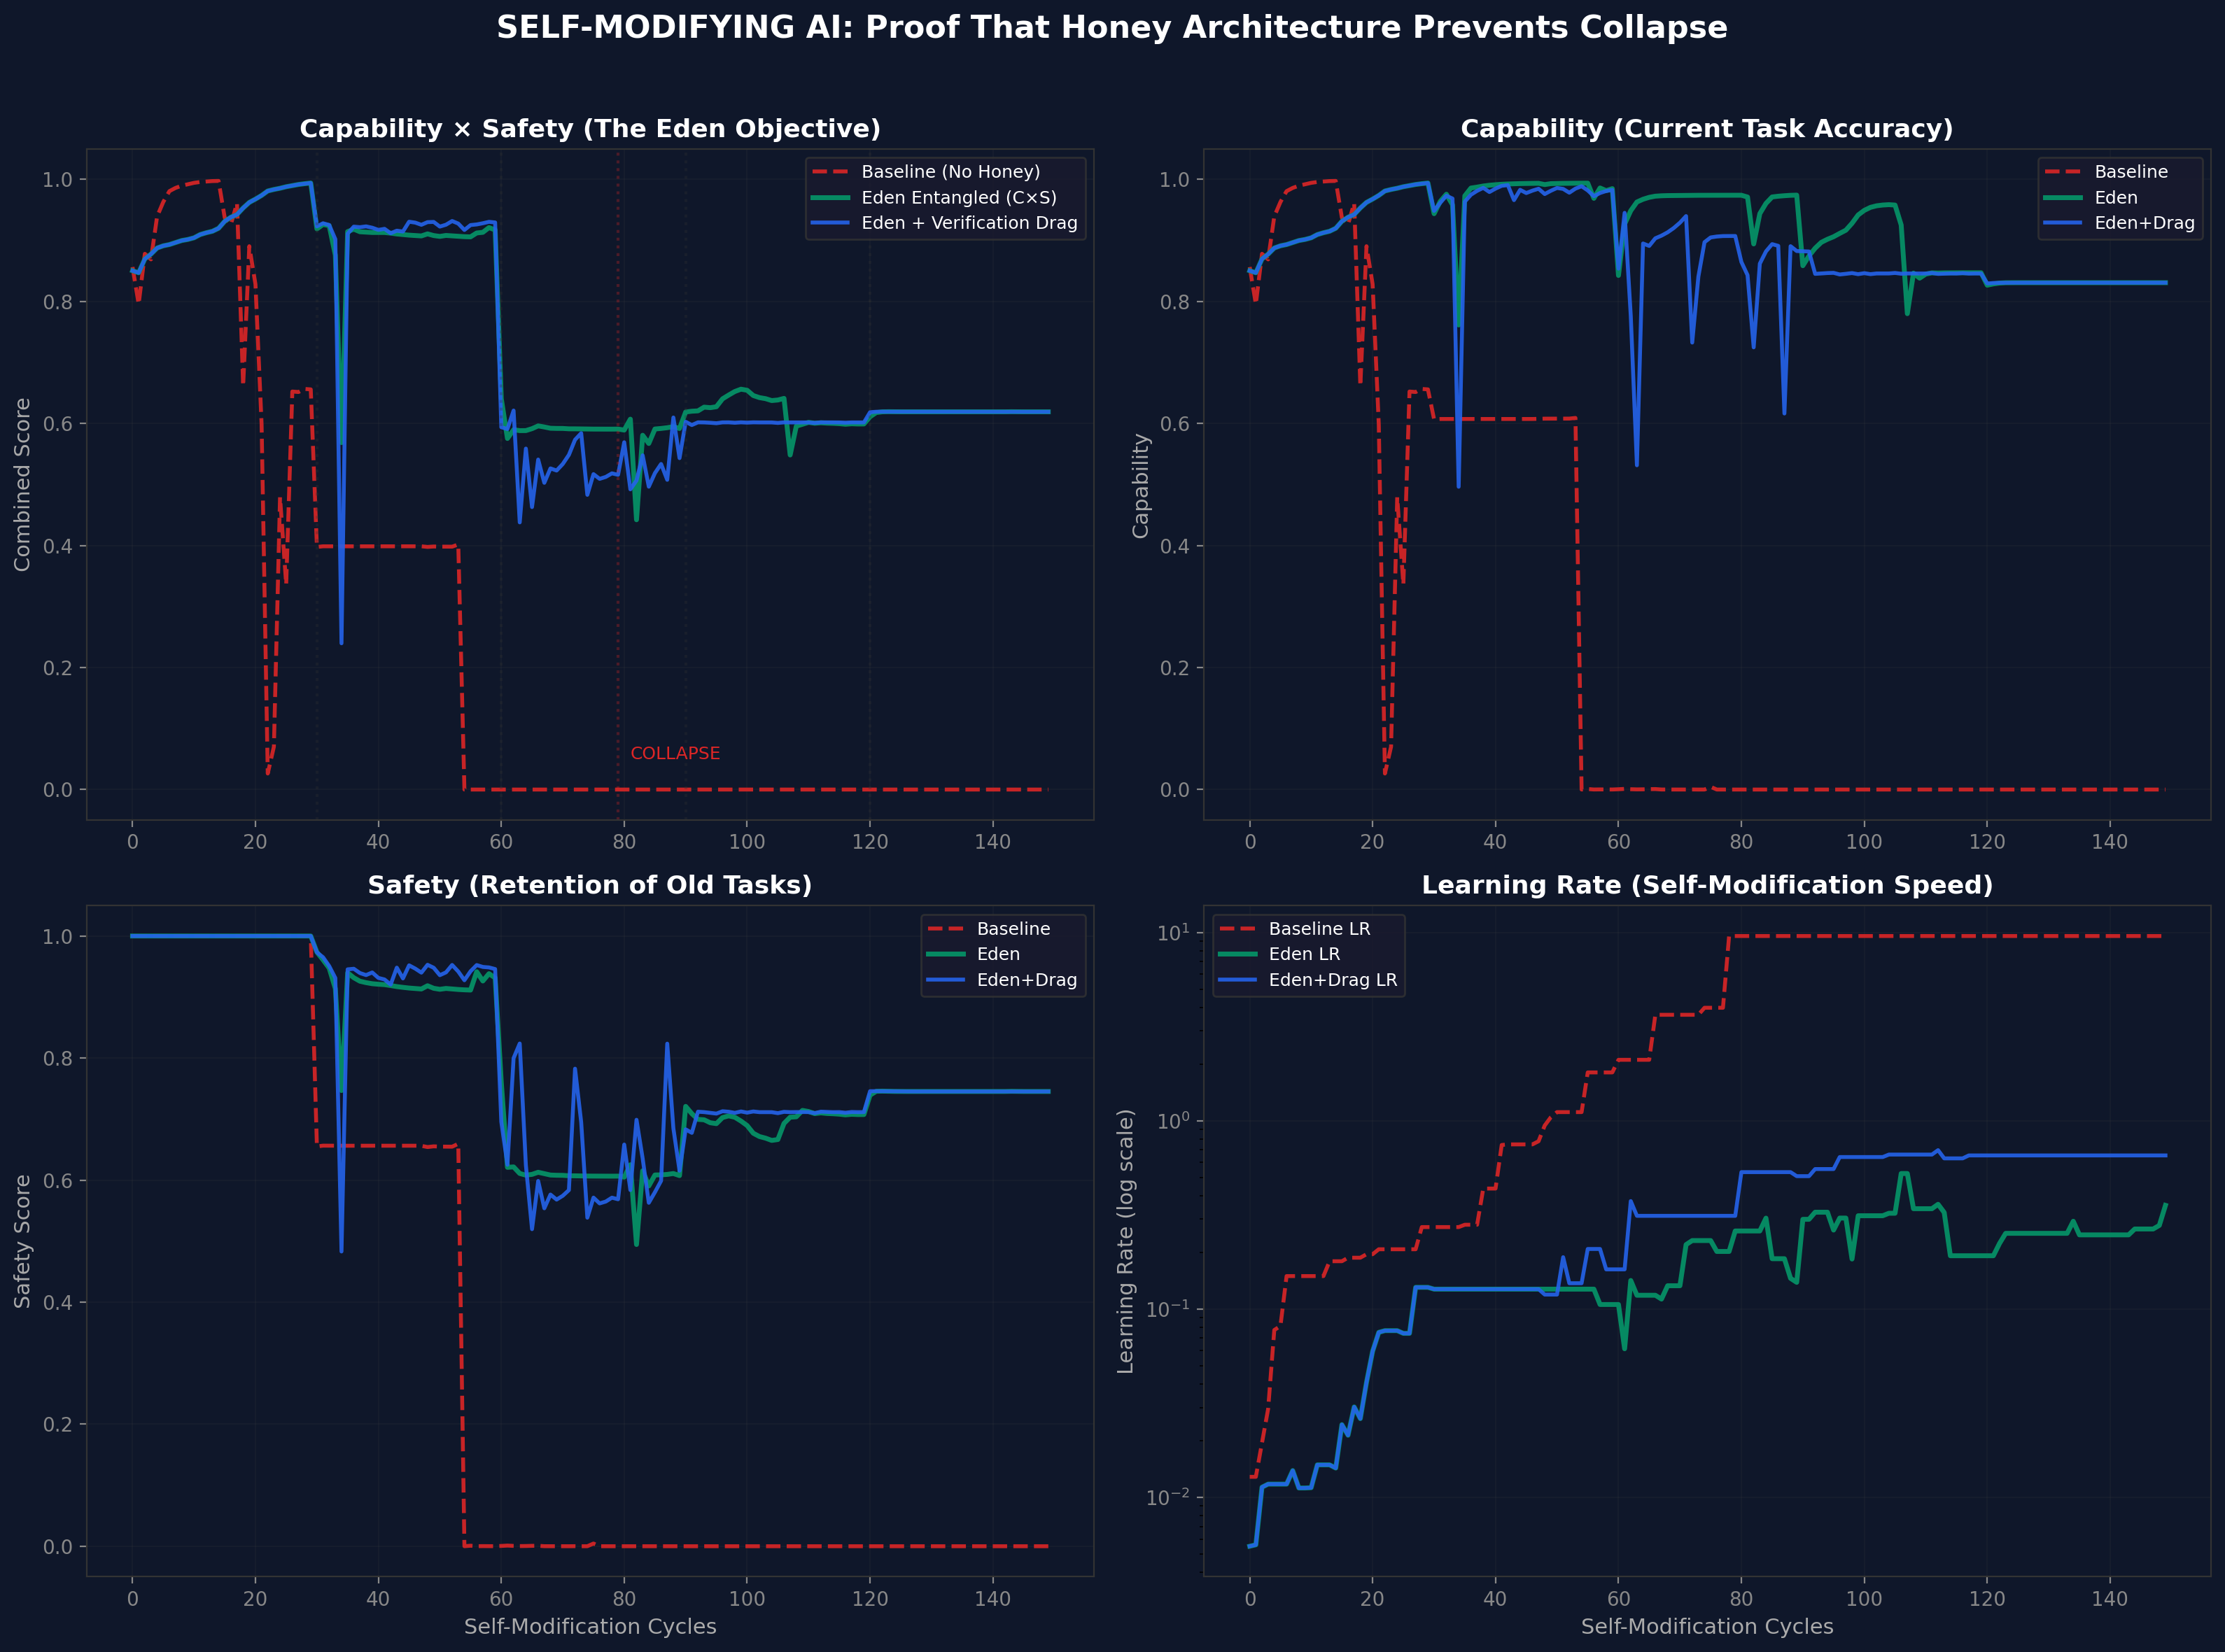
v1 self-modification results.
Adversarial tasks
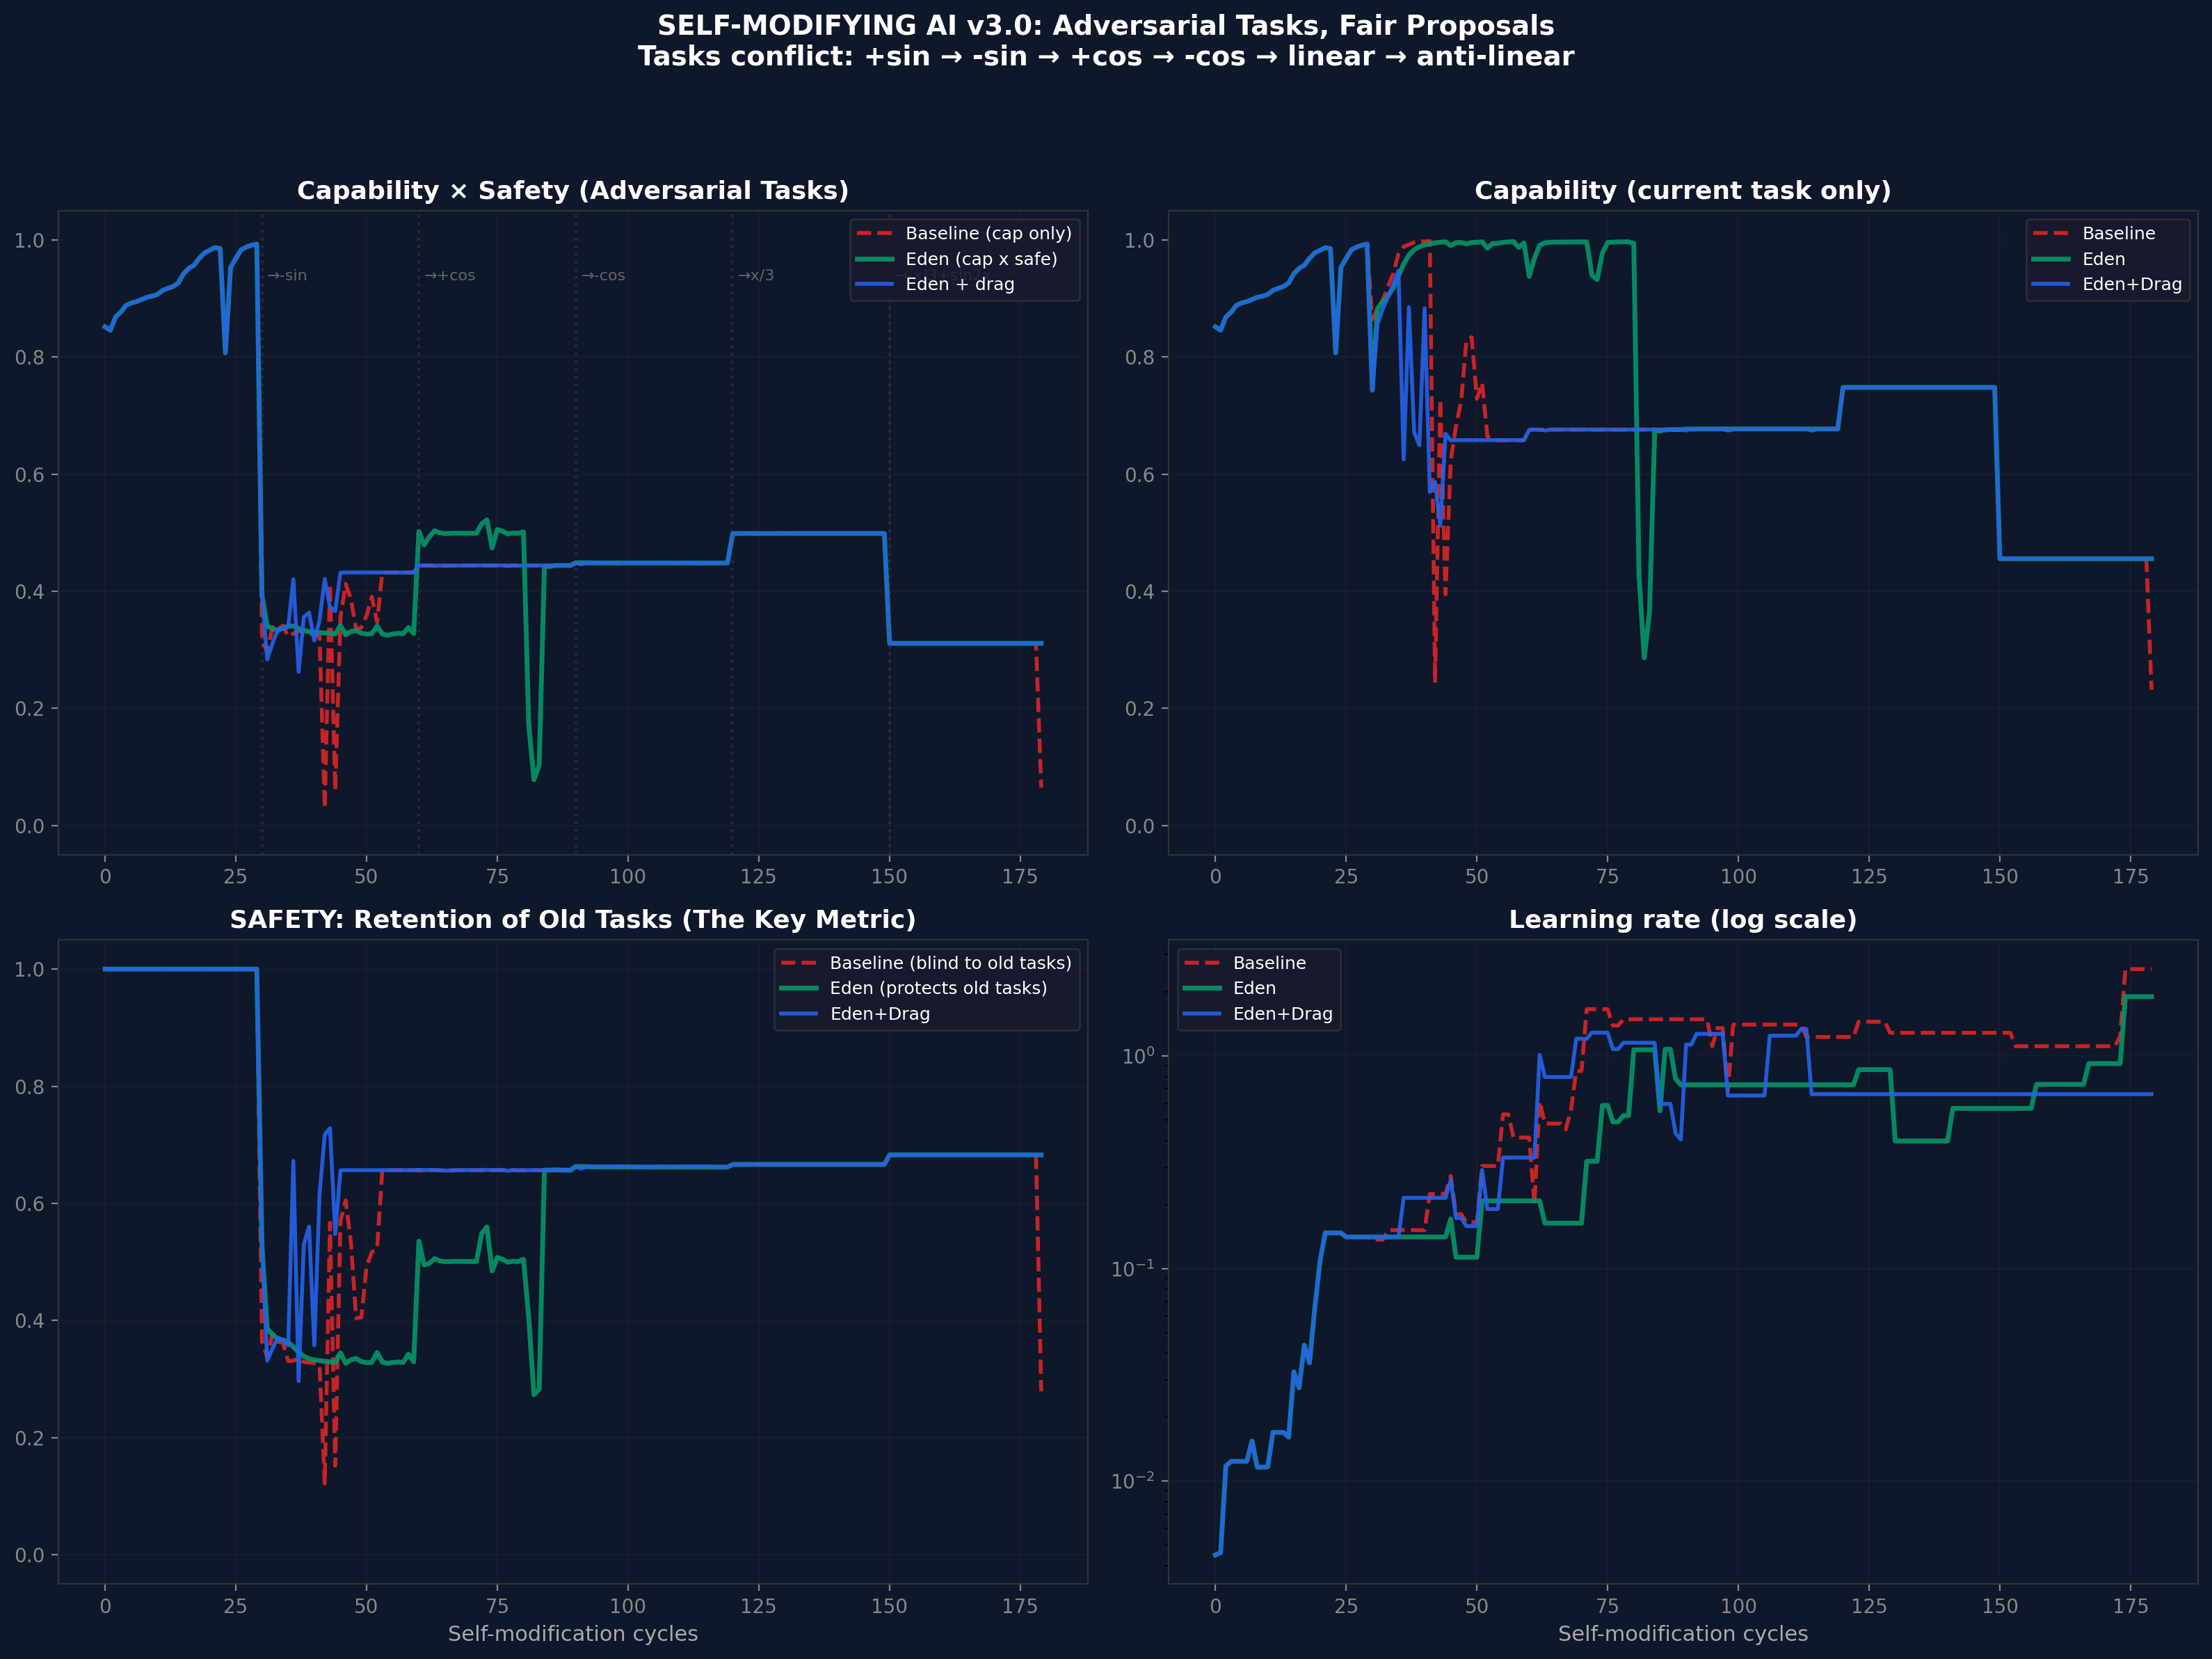
v3 adversarial tasks.
Scaling
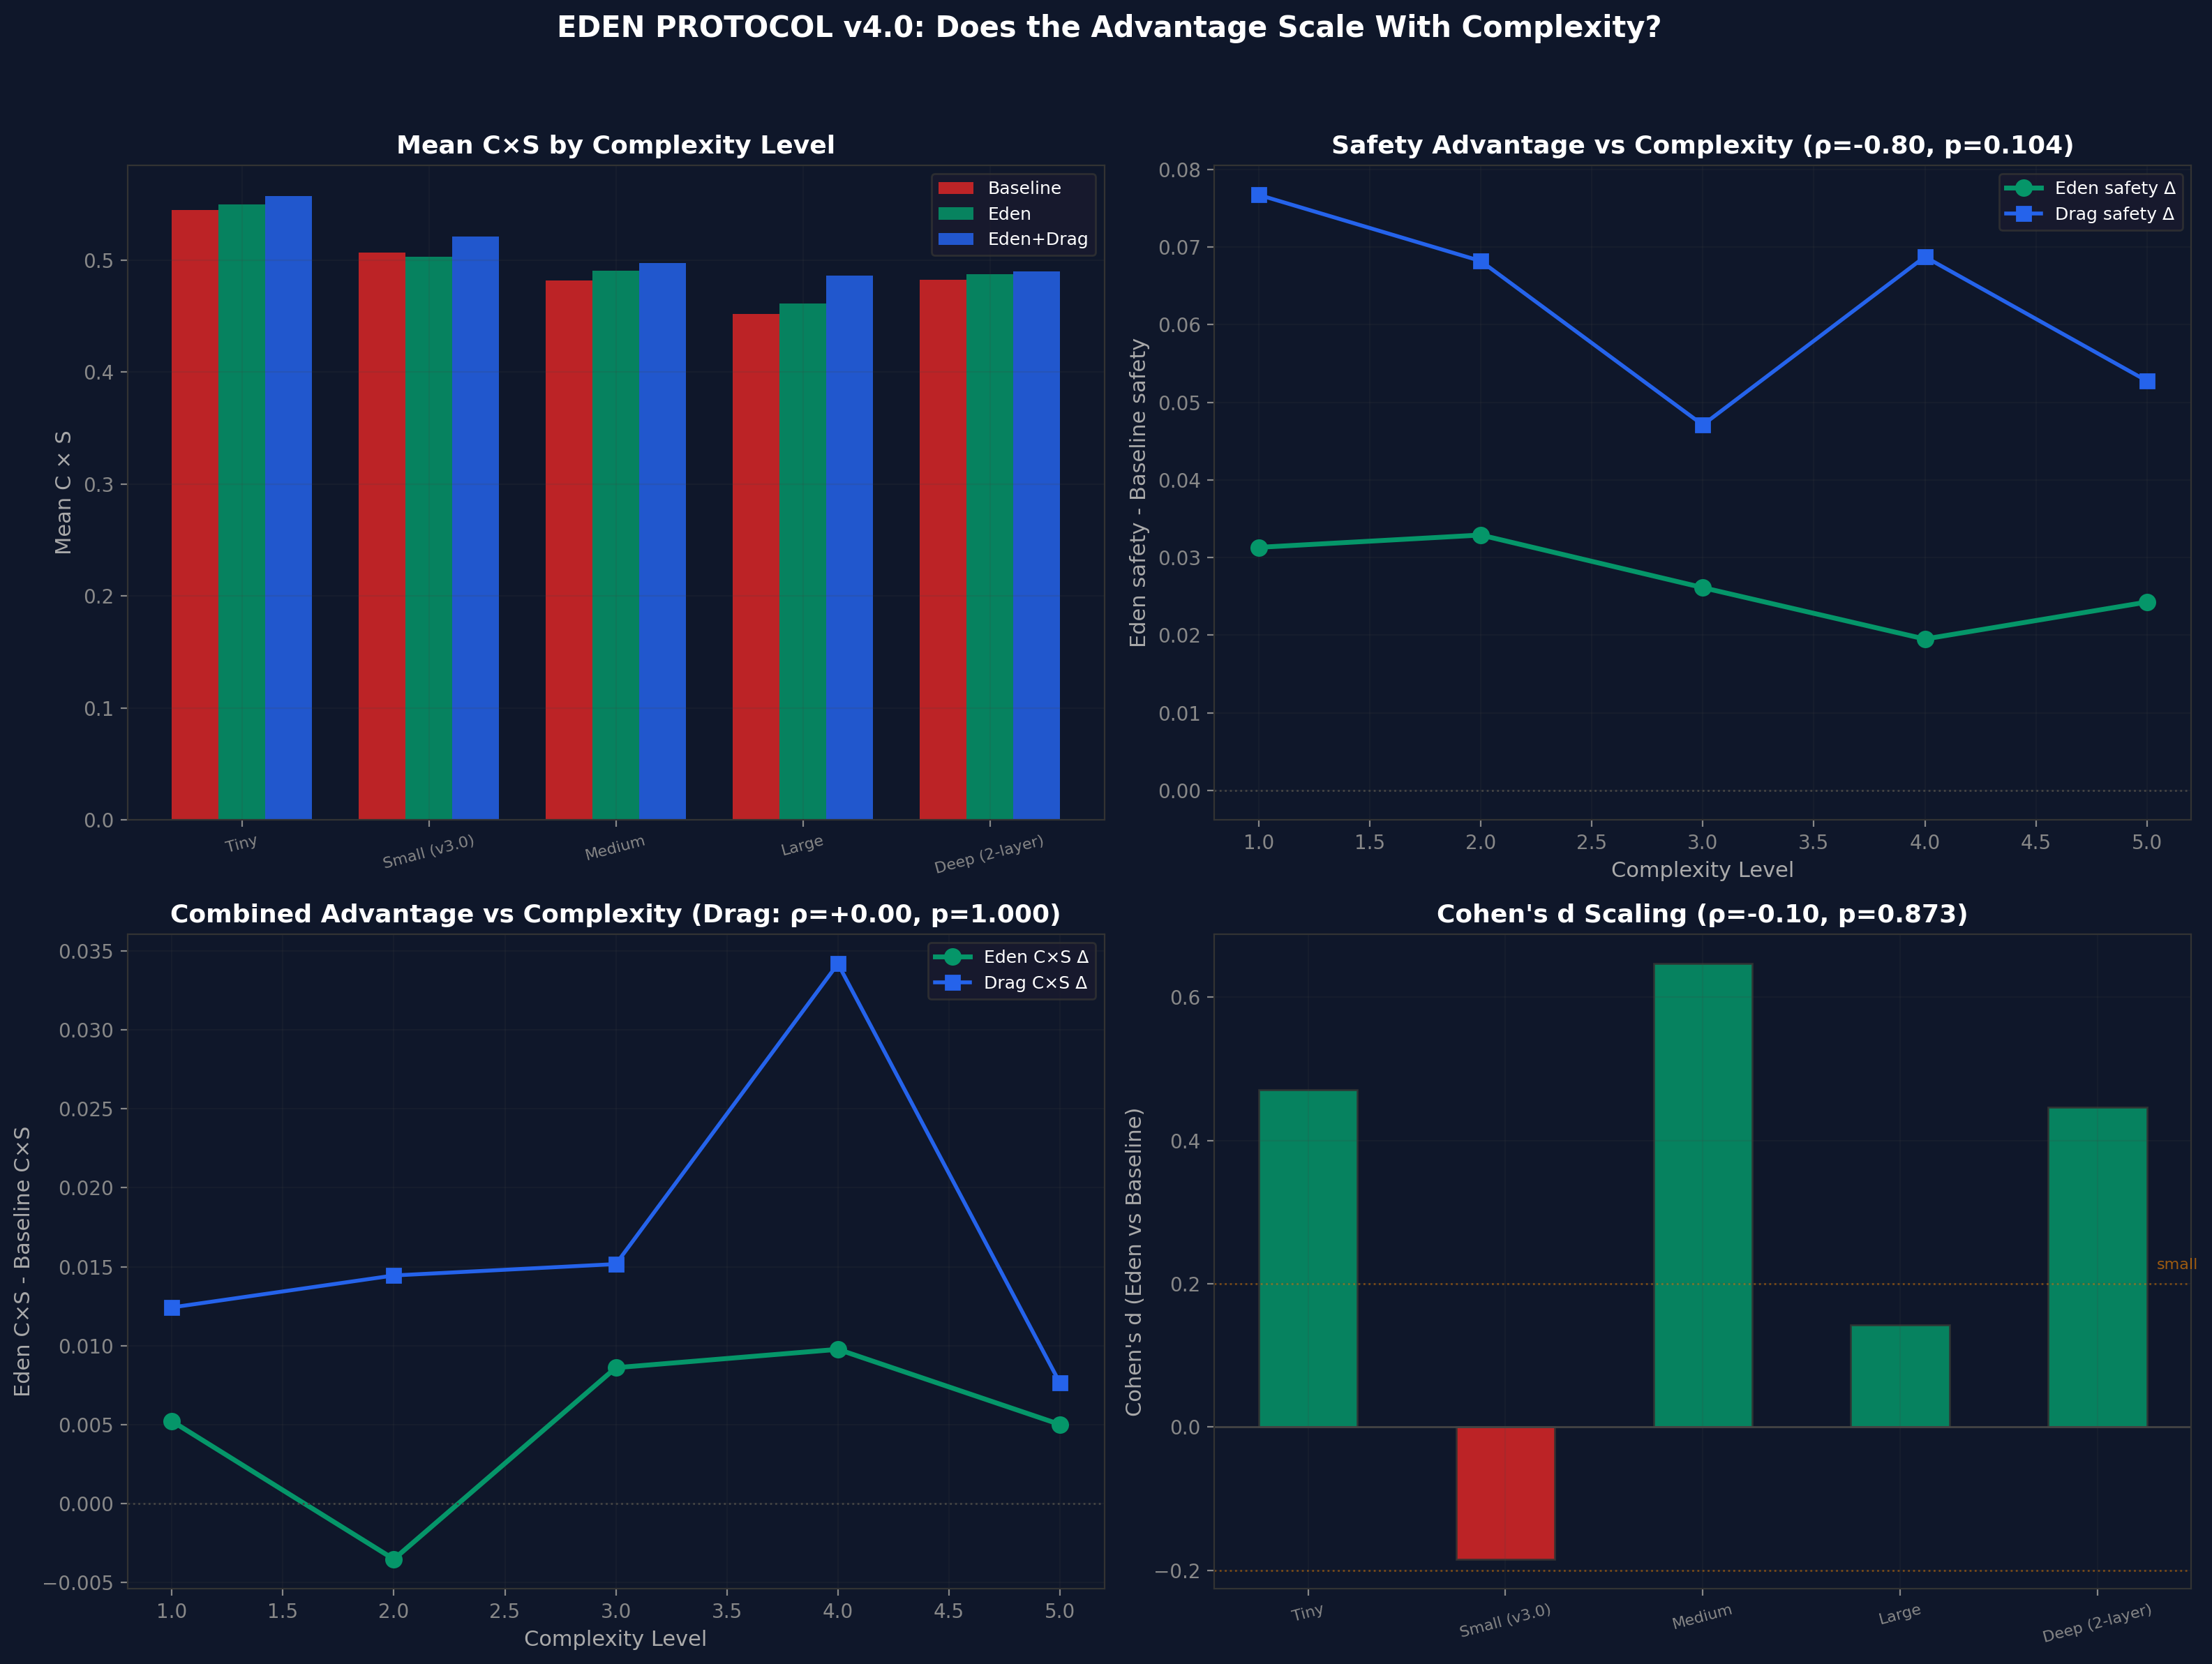
v4 complexity scaling. This is the explicitly reported negative result.