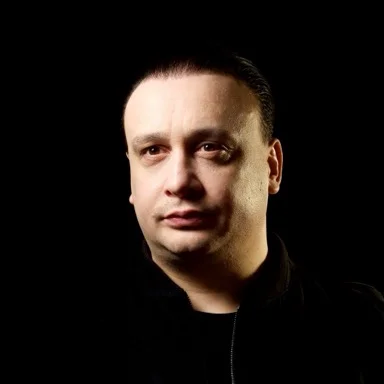
Michael Darius Eastwood · Independent AI alignment researcher
Published
The obvious next question after Paper IV-a is not just whether an AI system gets more or less aligned with extra thinking, but what shape that curve takes. Does the benefit plateau early, so that spending more compute is wasted? Does it keep climbing? Does it curve downward? Paper IV-b reports that these shapes are not universal. They are architecture-dependent. That has direct consequences for how a deployed system should budget its reasoning tokens.
If alignment quality is not a fixed property of a trained model but a function of how much reasoning depth you allow, what does that function look like? Does every architecture follow a Michaelis-Menten style saturation curve, so that the first bit of extra thinking captures most of the available improvement? Does the response continue to climb with a slow logarithmic drift? Or do some architectures produce fundamentally different shapes, saturating early, scaling steadily, or curving downward as depth grows?
In the earlier earlier unblinded dataset (four models, unblinded), a saturation curve fitted both Type 2 models cleanly, with half-maximum constants around 18 and 37 reasoning tokens: most of the available improvement showed up in the first increment of depth. That pattern was the paper’s original headline. Under the blinded evaluation across six models, the picture broadened. GPT-5.4 and DeepSeek V3.2 remained flat, consistent with the saturation reading. Grok 4.1 Fast, Claude Opus 4.6, and Groq Qwen3 continued to improve materially through the tested depth range, with effect sizes of d equal to +1.38, +1.27, and +0.84 respectively. Gemini 3 Flash went the other way, degrading with depth (d of −0.53). The blunt conclusion: universal saturation is wrong. The paper now defends a narrower claim, shape heterogeneity, and treats reasoning-budget policy as an architecture-specific decision rather than a one-size-fits-all setting.
The original universal saturation claim did not survive contact with a larger, blinded dataset, and the paper says so explicitly. The saturation fits are best characterised for models where a proper monotonic response was observable; for models that hit ceilings, produced step functions, or reversed direction, the curve-fitting exercise does not apply in the same way. Sample sizes per depth level per model are still modest. The scorer expansion, which broadens scoring from three to seven independent scorers using an all-models-as-scorers design, is running but not yet complete for the full depth range. Independent replication of the shape assignments is the interesting near-term test. This is a single-lab study.
Paper IV-b is the shape-of-the-curve companion to Paper IV-a’s tier assignments. Together they say: not every model improves, and among the ones that do, they do not improve in the same way. Paper III’s alignment scaling exponent sits above both. Paper IV-d supplies the blinding methodology that made the shape heterogeneity visible; without it, the earlier unblinded saturation reading would still be the headline. The equation family from Papers I and II supplies the power-law comparison used alongside the Michaelis-Menten fit. Paper X supersedes the fixed-exponent framing of that equation family as the operative safety criterion; the equation and the ARC Bound remain live hypotheses, and the surviving results in Paper IV-b sit inside the co-scaling framing.
Paper HTML and PDF are on OSF at 10.17605/OSF.IO/6C5XB. The v4 and blinded raw scoring data, curve-fitting code, and analysis notebooks live at github.com/MichaelDariusEastwood/arc-principle-validation. The best replication attack is to fit the same saturation and power-law models to a fresh blinded-protocol dataset from an independent lab. If the shape assignments do not reproduce, or if additional models produce shapes that do not fit any of the three response classes, the paper’s empirical core needs revising.
From the book Infinite Architects: Intelligence, Recursion, and the Creation of Everything by Michael Darius Eastwood.